I have been following the Bad astronomy board with the EU subject line, since someone from there came to my site. I think that there are some similarities between what I have been researching and EU ideas. All of the conclusions I have reached are a result of reading scientific research, and continuing on past the point where lack of further funding stopped the original researchers. It is not so much a "new paradigm" just a composite of research that was discontinued, for lack of funding or interest by main stream meteorology. It is astrophysics, with real data, weather records and a cyclic pattern used to create a forecast that works better in the ten day to 90 day range than the standard models.
http://www.aerology.com/national.aspx
To view maps for the entire year 2008
enter user name.......Kstate
and password .........Maps08
I have posted to my site, daily weather forecast maps, of the forecasts I generated. My web site contains no commercial content. It is only intended to show new ideas that have been overlooked. I had not heard of the contested EU ideas until I found these boards. If you do not find my forecasts to be accurate (after really looking them over) I would like to know what % of accuracy they did archive.
(Sites for solar wind flow and charge data are available at:)
http://www.n3kl.org/sun/noaa.html
http://www.lightning.ece.ufl.edu/
http://www.giss.nasa.gov/research/stories/20030210/
http://www.pbs.org/wgbh/nova/magnetic/
a good source of planetary positional information can be found at:
http://space.jpl.nasa.gov/
http://ssd.jpl.nasa.gov/cgi-bin/eph
These are some of the sources of data I use in my research. when the conventional methods are as good as the 30 to 90 day ahead results that I get, I will quit doing what I am, till them someone has to do it. I think freely contributing my time, without asking for any federal funding is no reason for being attacked by persons with less understanding of reality, than can be easily found in the research data base.
Nice link to an article about solar induced currents into the earth's weather system...
http://www.gsfc.nasa.gov/topstory/2004/ ... storm.html
patterns of ozone production and movement can be followed at the link to one of their pages...
http://toms.gsfc.nasa.gov/
They have a nice archive of past ozone patterns available on their ftp site. I have used this data to track effects on earth's weather after solar flares, and during the occurrence of Heliocentric conjunctions of Earth with the other planets. It is from making many observations over the past several years that I have come to the conclusions posted here.
http://www.sec.noaa.gov/primer/primer.html
The region between the Sun and the planets has been termed the interplanetary medium. Although once considered a perfect vacuum, this is actually a turbulent region dominated by the solar wind, which flows at velocities of approximately 250-1000 km/s (about 600,000 to 2,000,000 miles per hour). Other characteristics of the solar wind (density, composition, and magnetic field strength, among others) vary with changing conditions on the Sun. The effect of the solar wind can be seen in the tails of comets which always point away from the Sun.
The solar wind flows around obstacles such as planets, but those planets with their own magnetic fields respond in specific ways. Earth's magnetic field is very similar to the pattern formed when iron filings align around a bar magnet. Under the influence of the solar wind, these magnetic field lines are compressed in the Sun ward direction and stretched out in the downwind direction. This creates the magnetosphere, a complex, teardrop-shaped cavity around Earth.
The Van Allen radiation belts are within this cavity, as is the ionosphere, a layer of Earth's upper atmosphere where photo ionization by solar x-rays and extreme ultraviolet rays creates free electrons. Earth's magnetic field senses the solar wind its speed, density, and magnetic field. Because the solar wind varies over time scales as short as seconds, the interface that separates interplanetary space from the magnetosphere is very dynamic.
Normally this interface called the magneto pause lies at a distance equivalent to about 10 Earth radii in the direction of the Sun. However, during episodes of elevated solar wind density or velocity, the magneto pause can be pushed inward to within 6.6 Earth radii (the altitude of geosynchronous satellites). As the magnetosphere extracts energy from the solar wind, internal processes produce geomagnetic storms.
Air masses and the clouds in them, that are perturbed from equatorial areas carry a net positive residual ionic/static charge, that helps prevent rapid condensation, by mutual static repulsion between condensational nuclei. These static charges helps to maintain more uniform size of nebulized droplets, aids in super cooling, and results in rapid precipitation when meeting air masses from more polar regions which carry a residual negative ionic/static charge, that also prevents rapid condensation by mutual static repulsion inside of the clouds in the polar air masses.
Upon meeting at a frontal boundary, the static charges on the colliding air masses allow the condensational nuclei to attract each other, and help the temperature gradient, to generate the rapid precipitation usually seen in narrow frontal boundaries.
No where have I said anything about dropping any of the standard practices, I have only said that a few things had been left out of the mix. One of the ingredients concerns the variations in the homo polar charges on the Earth, and the interaction with fluxes in magnetic field strength of the passing solar wind.
The Moon is magnetically and gravitational locked to the Earth, and when I looked at the Auroral displays, the extension of fields between the Earth and Moon produces a bulge in the displayed Auroral activity that rotates with the moon. Lunar permanent magnetic fields balance induction forces that are felt upon the Earth (working similar to someone moving a magnet in and out of a coil), counter balancing the Solar magnetic field rotation at the same 27.32 day frequency. The lunar declination period results from, these Interplanetary magnetic fluxes that drives the magnetic fields of the Earth's internal dynamo into typical shock excited oscillations, at the driven periodicity.
It is the Earth/Moon barycenter, not the center of mass of the Earth alone that scribes the smooth ellipsoidal orbit of the Earth/Moon system on the ecliptic plane, the center of mass of the Earth follows a spiraling path, as a result of the leveraging of the moon's declinational and rotational movement. With this spiraling of the center of mass of the Earth above and below the ecliptic plane. The Lunar declinational component cycles from a minimum of 18 1/2 degrees, to a maximum of 27 1/2 degrees in the 18.6 year Mn cycle, displacing the center of mass of the Earth 800 Km to 1400 Km either side of the ecliptic plane.
Increases in the global homo polar generator magnetic fields, increases the pole to equator potential, slows down the polar negative leakage, increases the generation of positive ions at the equator and ITZ, and during the charging cycle time inhibits tropical precipitation rates. Adds positive ion energy to hurricanes that are moving to the mid latitudes, (that just happen to be) in sync with the lunar equatorial crossings (North or South).
With the inverse mechanism in effect post Synodic conjunctions, with periods of decreases in field strength, the global circuit discharges through fast moving polar air masses, that carry these strong negative ionic / static discharges, so that when meeting equatorial air masses give rise to increased intensity of thunderstorms. At times of the year when the Earth comes into alignment with the outer gas planets, these effects are increased in proportion to resultant magnetic flux changes, and are felt as changes in the global weather patterns. The addition of other heliocentric conjunctions of other planets, in combinations, also affect the Earth's global circuit to some degree, depending on the planets' sizes and Synodic angular proximity to the Earth.
http://sec.noaa.gov/pmap/index.html
http://www.nerc-bas.ac.uk/public/uasd/m ... intro.html
http://hpiers.obspm.fr/
http://www.mpe-garching.mpg.de/www_plas/plasma.html
http://science.nasa.gov/headlines/y2001 ... list159023
http://news.bbc.co.uk/1/hi/sci/tech/671874.stm
http://www.spaceweather.com/
http://sec.noaa.gov/today.html
You are right that the permanent field of Venus is weak and disoriented. The permanent magnetic fields of other planets have been measured by NASA probes. Such fields are too weak, and the other planets much too far away, to have any noticeable effect on the magnetic field near the Earth. Maybe a little basic electronics training is in order here, Ferro magnetic materials take on a permanent magnetic field orientation when in the form of crystals that cooled quickly. The orientation of the permanent fields orients with the field lines dominate at the time of quenching from the melted or heated state. Nice examples are the central ocean ridges and the evidence for polar magnetic reversals for the Earth. When the magnetic materials are bound up into compounds that leave no pure iron crystals, the resultant permanent field is very weak or non-existent.
However the magnetic permeability (the ability to conduct magnetic fields) remains strong in the gaseous or liquid state, and in varying degrees in solid compounds. Looking at the solar system as a composite system, with the sun at the magnetic center, and the planets, and all of the small
bodies revolving around it as an integrated magnetically connected whole. The natural assumption I make is that all of the dynamically fluxing magnetic fields extending from the sun are coupled into all of the bodies in a relevant strength, dependent upon the amount of magnetically permeable material included in that body. Not the weak standing residual field created from the solidification of their crusts.
The ionized particles in the flow patterns of the solar wind follows the pattern of the magnetic field lines that are focused by the relativity highly conductive Ferro components in planetary bodies. These Ion streams are well know for the large gas planets, but exist for all bodies, it is these saturateable core passive induction, forces that, coupling the magnetic field flux that forms the solar wind flux, as ions are pulled out from the sun as a result of the expansive surges in the magnetic field lines pulled out to couple thru the increased resultant coupling thru Synodic planetary alignments as they pass one another. When the earth is in the line of fire of these magnetic storms, we have satellite radiation assault problems.There are also, resultant ACTIVE magnetic fields, internally generated due to the magnetic reluctance induced setting up MHD fields and eddy currents which creates power outages.
I have now posted to my national forecast pages, the combined last three cycles of data. The repeatability is still good. Trends in the patterns this time can be found in the 54 day pattern that carries over to the "today,s forecast". This data is also still presented, without any compensation for residual differences between the cyclic patterns. I am gaining insights on how the driving forces in the current cycle are varying from the other three. I am still wanting to design an active program that combines, the past three cycles, and the recent / current variances, and derive compensations for adjusting the "Forecast" to reflect the current differences.
aerology
01-July-2004, 09:39 AM
http://space.jpl.nasa.gov/cgi-bin/wspace?
What I find important is the alignment of the planets with each other with respect to the sun (Heliocentric) and when also in line with the center of the milky way. These effects are related to magnetic flux strength, which has some effect upon the global weather patterns on ALL of the planets. If you watch the dust storm patterns on Mars for several years, Mars has severe dust storms every time it gets passed by the Earth. Or when ever it laps one of the outer planets.
http://nova.stanford.edu/projects/mgs/dmwr.html
http://arc.iki.rssi.ru/eng/index.htm
http://www-mgcm.arc.nasa.gov/MGCM.html
And from the last link.....
LARGE DUST STORM SWALLOWS MARS
June/July, 2001: Beginning in mid-June, 2001 a region of increased dust abundance began to appear in the Hellas Basin. This activity persisted for over a week until June 26 when the storm began to intensify and expand.
Earth had a heliocentric conjunction with Mars on June 13th 2001, while both of them were in opposition to Jupiter with in the next 48 hours. All in line with the sun and the center of our galaxy.
If someone with a good working knowledge of calculator with scientific notation, Watts/meter^2, or would whip out a slide rule and figure the net electrical power involved in the inter action of the solar wind with say a conservative 6 earth radii. In terms of Gigga watts per hour, or whatever values applies, might put this argument into prospective, rather quickly.... Values for the parameters could be found at several links I already posted. Speed in Km per second, X density about 1 electron per cm^2, X cross sectional area of 6 Earth radii= Wattage x10^???
Nice graphics for those that learn visually
http://www.universetoday.com/am/publish ... tml?272004
3D View of a Coronal Mass Ejection. 8)
I invoke "Fair Use" to quote the following archive extracts.
"Solar Activity and Terrestrial Thunderstorms," New Scientist, 81:256, 1979.
Data collected from electrosondes (balloons measuring atmospheric electrical currents) over the Antarctic ice caps infer that solar flares stimulate large surges in the flow of electrical charge from the upper atmosphere to the earth's surface. Because this unidirectional flow of fair-weather electricity must ultimately be balanced by thunderstorms somewhere on the planet, it follows that the frequency and severity of terrestrial thunderstorms are dictated, at least on the average, by solar activity. Formerly, global circuit theory had it that the thunderstorms themselves were the driving force behind the fair weather current flow. Now it seems that the sun calls the tune and that thunderstorms do not arise at random."
"Do Cosmic Rays Trigger Lightning Discharges?" New Scientist, 77:88, 1978.
"Science has long claimed to have the explanation of lightning discharges well under control. But the discharge paths followed by lightning strokes often seem unnecessarily tortuous when more direct routes are readily available. The mechanism by which large reservoirs of unlike charges are built up is also obscure. Cosmic rays have now been proposed as both a source of charged particles and a provider of low-resistance ionized conduits for lightning to follow. Primary cosmic rays carry considerable energy, most of which appears near the earth's surface in the form of cascades of secondary particles that create complex ionized tracks as they penetrate the dense lower atmosphere. Lightning bolts would tend to follow these precursors along their crooked trails."
(http://radarmet.atmos.colostate.edu/~kw ... day-a1.htm)?
Seems that current research still considers electrification to be the result of thunderstorm formation, not the cause. "...For reasons that are not widely agreed upon, a cloud-to-ground lightning flash originates in this mixed water and ice region...!"
This seems to be a fairly typical textbook explanation, missing out, as ever, the reasons for the charge accumulation.
Even granting, for the moment, that "electric weather" is worth considering, its value in weather forecasting needs to be demonstrated (as an "interesting hypothesis," it does little or no practical good). Exactly how do we forecast the occurrence of thunderstorms, using the electric weather/universe approach? What about other types of weather? So I have spent 30 years and thousands of dollars, getting my site on line, to find out for my self.
Electricity and weather are inextricable linked. But electricity does not necessarily cause local weather to behave in a certain way since there are many other stronger factors. But it does influence global weather, which in turn influences local weather. This view accords with a recent report (17 November 2003) in Geophysical Review Letters by Joseph Dwyer of the Florida Institute of Technology, which says that according to conventional theory electrical fields in the atmosphere simply cannot grow large enough to trigger lightning. “The conventional view of how lightning is produced is wrong.” And so “the true origin of lightning remains a mystery.”
The article goes on to say that differentials may trigger lightning, although they are not responsible for the charge build-up. This is not the view of conventional meteorology, sure, but maybe this will change...
But to completely ignore the effects of electricity on weather, when (a) the Earth is being hit by 50 to 100 thunderbolts per second, (b) the upper atmosphere is carrying million ampere currents (c) the atmosphere has a vertical electrical field of up to 100 volts per meter, seems to me to be a little short-sighted. [Reference: The Earth's Electrical Environment (1986) On line in full (http://www.nap.edu/books/0309036801/html/)]
(So far as I know) I am about the only person to spend 25+ years looking at Lunar declinational tidal effects as "The main meridional forcing mechanism of the atmosphere." I think that in finding the proof of the connections between the Solar wind variations, global weather patterns, the electromagnetic interactions of the solar wind with the planets, lies the key to solving the long-term modeling problem's and providing answers that work.
Electrical weather based analog forecast
-
Carl Smith
- Guest
Re: Electrical weather based analog forecast
Hi Richard, and welcome.
Glad you found this place, as you may find some interesting facets of EU that support / illuminate your ideas (along with a whole lot of other interesting stuff )
)
As some of what you write is in keeping with my own thoughts on both electric weather and the cosmic connection, I may engage some astronomy related parts of what you presented over on BAUT where the mainstreamers there can hack away at it if I get time - the 1 month ATM thread expiry there can be frustrating if one has a life beyond the internet.
I hope others engage you in the electrical side of things here, as there are some quite experienced people who may have some interesting questions and/or information for you.
Regards,
Carl.
Disclosure: I have communicated with Richard off and on for several years where we discussed in various depths weather, climate, electrical phenomena, and planetary motion (although it has been a while now). He is a serious researcher who has dedicated many years towards discovering what he is sharing here with everybody, and he is also open to learning new things. I notice from his website that his ideas have progressed to the point where he is now offering a unique web-based free US long-range weather product (I would like to see him to get a global version up and running - but he is going to need some help to get there).
Glad you found this place, as you may find some interesting facets of EU that support / illuminate your ideas (along with a whole lot of other interesting stuff
As some of what you write is in keeping with my own thoughts on both electric weather and the cosmic connection, I may engage some astronomy related parts of what you presented over on BAUT where the mainstreamers there can hack away at it if I get time - the 1 month ATM thread expiry there can be frustrating if one has a life beyond the internet.
I hope others engage you in the electrical side of things here, as there are some quite experienced people who may have some interesting questions and/or information for you.
Regards,
Carl.
Disclosure: I have communicated with Richard off and on for several years where we discussed in various depths weather, climate, electrical phenomena, and planetary motion (although it has been a while now). He is a serious researcher who has dedicated many years towards discovering what he is sharing here with everybody, and he is also open to learning new things. I notice from his website that his ideas have progressed to the point where he is now offering a unique web-based free US long-range weather product (I would like to see him to get a global version up and running - but he is going to need some help to get there).
-
Carl Smith
- Guest
Re: Electrical weather based analog forecast
Cross posted from BAUT.
Richard, I finally got a little bit of time to look at this.
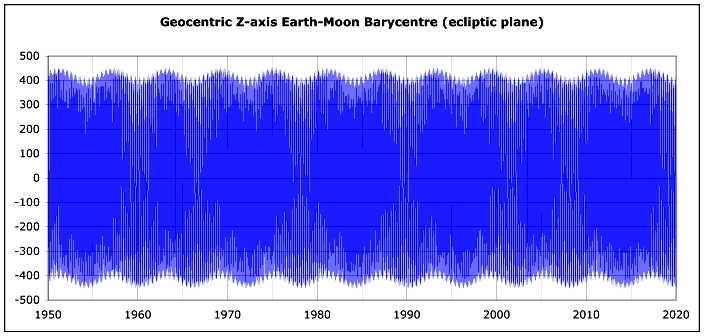
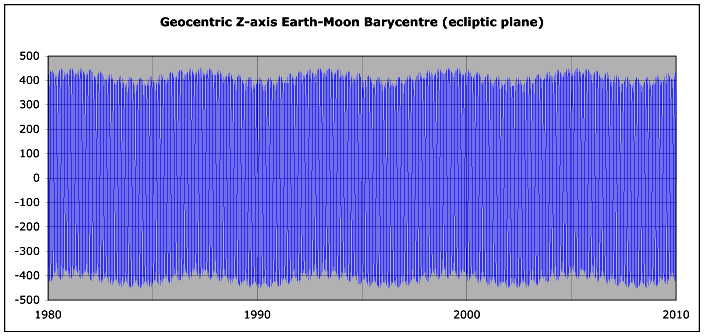
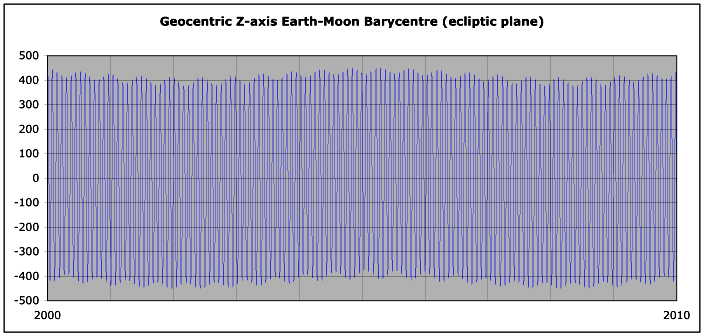
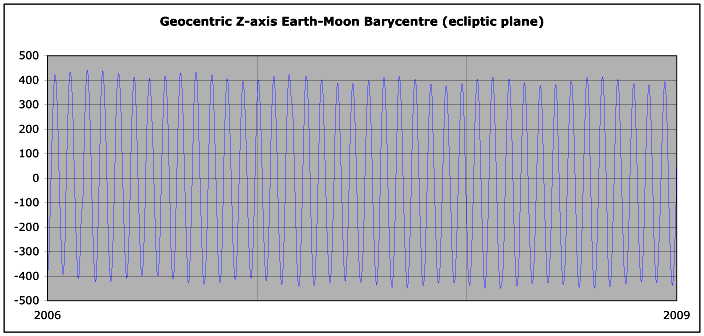
Below are some graphs of the Geocentric Z-axis in km of the Earth-Moon barycentre in ecliptic coordinates at various time scales as generated by the NASA JPL Horizons Online Ephemeris - can you elaborate on how the Earth's ~400 km wobble above and below the ecliptic plane may be useful for weather forecasting?
Richard, I finally got a little bit of time to look at this.
Below are some graphs of the Geocentric Z-axis in km of the Earth-Moon barycentre in ecliptic coordinates at various time scales as generated by the NASA JPL Horizons Online Ephemeris - can you elaborate on how the Earth's ~400 km wobble above and below the ecliptic plane may be useful for weather forecasting?
-
Aerology
- Posts: 18
- Joined: Mon Apr 28, 2008 3:29 am
Re: Electrical weather based analog forecast
Quote:
Originally Posted by Carl_Smith View Post
Richard, I finally got a little bit of time to look at this.
Below are some graphs of the Geocentric Z-axis in km of the Earth-Moon barycentre in ecliptic coordinates at various time scales as generated by the NASA JPL Horizons Online Ephemeris - can you elaborate on how the Earth's ~400 km wobble above and below the ecliptic plane may be useful for weather forecasting?
And my cross post response....
The last (three year graph) is of a scale I think that be used to understand the processes (that border on EU ideas) that I have come to realize, drive the severe weather outbreaks.
When the Center of mass of the Earth, is forced above or below the ecliptic plane, inductive forces place a differential static or ionic charge from one pole to the other, (normally maintained by Homo polar generator effects) shifting the normal positive band of charge at the ITCZ back toward the ecliptic plane intersection. When the COM of the Earth, is Maximum South, the counter balancing Moon is at Maximum North declination, for that 27.32 day long cycle.
The inductive charge gradient appears at the same time as the declinational angle culminates, and due to the pendulum movement effects, hangs at about the same angle for almost three days, before the two bodies sweep through the rapid movement phase, of close to 7 to 10 degrees per day across the equator (for the Moon), the ecliptic plane (for both).
There by producing surges in the meridial flow, via declinational tidal bulges in the atmosphere, in phase with the Lunar movement, and the creation and maintenance of a ionic charge gradient across the frontal boundary in addition to the thermal contrast, as well as the moisture content (dew point), for the three days at maximum declinational culmination. Enhancing the precipitation rates, maximizing and sustaining the ionic charge gradient.
Negative charges are free to travel as liberated electrons, that fan out ahead of the moving cold front, as the normal production of Sirius clouds.
Positive ionic charges on the other hand, have to move whole molecules, to travel, so are trapped mostly in the surface layers with high moisture content, that form the updrafts into the lightning producing clouds. As the ions from both sources rush toward each other, (typical convergence speeds in a thunderstorm are in excess of 50 to 70 MPH) all moisture with ionic charges on it combine to form neutral precipitation, all condensation nuclei, become trapped in the droplets, the moisture attracted to each other falls when massive, and the dust free cold air exits the clouds as down bursts, invisible outflows.
The visible clouds them selves, are constantly being reinforced with fresh ionized air mass, so the charge process due to non visible turnover, is many times the volume it appears to be as seen from the ground. Powering the rapid condensation, and the left over ionic charges are discharged as lightning. (Grapnel processes still apply to intra cloud transfer of charges) Most of the power is in the invisible incoming air flow, and the large volume of processed deionized air is also not visible as it exits the thunder cloud, which is what makes it dangerous for aircraft.
The tidal bulge dynamics can be used to judge the inertia of the frontal system to plot it's movement. And the inertia of the center of the air mass is a better indicator of the potential movement of a storm than the resultant frontal boundary or the low pressure generated along it. Once the tidal component is calculated into the tracking of tropical storms, and hurricanes, they take predictable paths, make turns as the Moon crosses the equator, and shift off to the north East, as the lunar declination goes toward Maximum.
-
Aerology
- Posts: 18
- Joined: Mon Apr 28, 2008 3:29 am
Re: Electrical weather based analog forecast
It's 5-22-2008 and the Moon is Maximum South, the weather is active in the central USA, and should be interesting as viewed,
http://www.spc.noaa.gov/climo/reports/080522_rpts.html
It is up in my back yard so to speak, I expect to see this activity level continue until the the 25th or 26th when the Moon has picked up speed again moving back North,
25th 2.84 degrees of movement
26th 3.85 degrees of movement
27th 4.70 degrees of movement
28th 5.41 degrees of movement
29th 5.92 degrees about to cross the equator
30th 6.22 degrees now North of the Equator 3.404 degrees
I selected the 1800 GMT data times to show the positions in the evenings,
in the central USA when the weather gets the most active. It started on the
20th of May 2008 when the evening Lunar declination was ~-24.95122,
peaked at ~-27.70712 on the 22nd. today.
-
MGmirkin

- Moderator
- Posts: 1667
- Joined: Thu Mar 13, 2008 11:00 pm
- Location: Beaverton, Oregon, USA
- Contact:
Re: Electrical weather based analog forecast
Wow, that's a heck of an opening post. ;o] Skimmed part of it, and it seemed rather promising.Aerology wrote:I have been following the Bad astronomy board with the EU subject line, since someone from there came to my site. I think that there are some similarities between what I have been researching and EU ideas. All of the conclusions I have reached are a result of reading scientific research, and continuing on past the point where lack of further funding stopped the original researchers. It is not so much a "new paradigm" just a composite of research that was discontinued, for lack of funding or interest by main stream meteorology. It is astrophysics, with real data, weather records and a cyclic pattern used to create a forecast that works better in the ten day to 90 day range than the standard models.
[snip]
I had not heard of the contested EU ideas until I found these boards. If you do not find my forecasts to be accurate (after really looking them over) I would like to know what % of accuracy they did [achieve].
[snip]
I look forward to hearing more.
Good times,
~Michael Gmirkin
"The purpose of science is to investigate the unexplained, not to explain the uninvestigated." ~Dr. Stephen Rorke
"For every PhD there is an equal and opposite PhD." ~Gibson's law
"For every PhD there is an equal and opposite PhD." ~Gibson's law
-
Aerology
- Posts: 18
- Joined: Mon Apr 28, 2008 3:29 am
Re: Electrical weather based analog forecast
More detail that might be OK in this forum....
Posted: May 29, 2008 4:00 PM
The Sun would have a large toroid shaped magnetic field, smoothly spherical and evenly distributed IF it did not have planets with magnetically conductive cores.
The sun’s magnetic fields in actuality are far from smooth, there are lines of magnetic coupling thru each of the planets that extend out from the sun and as they Synodically pass each other, these field lines interact via the plasma flows of the solar winds.
Each of the planets are homo polar generators in of themselves, as they rotate in the magnetic fields of the sun they generate standing static charges Positive at their equators, and Negative at the poles.
The total power generated by the constant rotating of the Earth results in a standing charge of about 100 volts per meter, measured in either a North to South direction or in elevation. This is the static state, given that there is no change in the angular momentum of the Earth or change in the strength of the Solar magnetic fields felt by the Earth.
The Magnetospheres of the planets are the demarcation of the interaction of the solar wind’s varying flux and the standing fields of the planet, and is the dynamic interface between the planet and the interplanetary magnetic fields, that are carried by flows in the strength and density of the ions in the highly conductive plasma, that is the solar wind.
When [planets] electromagnetic conductors (due to having ferro magnetic elements, Iron, nickel, etc..) line up, the field strength couples thru the planetary body, and its magnetosphere interface, temporarily increasing the total strength of the felt forces on the angler momentum / standing charge of the static fields of the planet.
Changing the total power in the system entails either changing the angular momentum or the standing voltage, or some of both as the real case turns out. In your car’s generator / alternator the metal core rotates in a magnetic field, additional winding act as a auto transformer increasing the voltage generated up to a usable value. As the RPM of the engine changes the output voltage changes, but due to the electrical system and battery loading the net output is a change of the current output.
In the case of the Earth, meeting the about 30 degree wide conductive swaths of ion streams trapped in the fields lines of the outer planets coupling to the sun at a Synodic passing, takes the earth about a month to cross, much like fording a stream of water. Beginning with a gradual increase of magnet coupling and peaking at the point of heliocentric alignment, the decreasing again until out of the stream flow.
The net result of the changes in these forces is felt on the Earth as a change in the standing pole to equator field by as much as 20% of the value of the normal static voltage field. The gases in the lower atmosphere are affected by the change and become more ionized, moisture laden air masses move off of the ITCZ toward the mid latitudes both North and South, as the polar air takes on a more negative charge.
Thus producing surges in the maridial flow for the two weeks up to the point of the maximum alignment of the magnetic coupling, then these charges begin dropping and result in spectacular displays of atmospheric weather displays, as the ionic potential discharges back toward normal via precipitation generation enhancement across the frontal boundarys, and lightning discharges the residual air to ground static gradient.
Richard
Page 2
These charge / discharge effects from the planets magnetic interactions, progress thru the calendar Neptune about three days later each year, Uranus about seven days, Jupiter about 37 to 38 days, Saturn about 13 to 14 days. So their effects are almost seasonal for some for several years (Neptune and Uranus) in a row, then move into the next season for several years.
The seasonal shifts caused by the faster planets Jupiter and Saturn slide thru the years and the common reference to their effects, (although not recognized as such) are decadal oscillations of the Pacific or the Atlantic basin circulation patterns.
Modulated on top of these slow frequency pulses are Lunar declinational tidal pulses in the atmosphere, as the Moon goes from Maximum North to Maximum South, and back to Max North in 27.32 day cycles there are produced surges in the meridial flows coming off of the ITCZ into the mid latitudes and being met by polar air masses to make a composite tidal bulge, as the moon goes to culmination at Max North or South declination.
There is four fold pattern in the type of sinusoidal waves generated in the atmosphere, (Commonly called Rossby Waves) shaped by the flows generated by the lunar tides and the topography, running thru the center of these patterns are the frontal boundaries between the air masses, where the contrast in temperatures, dew point, and ionic charges (the attracting forces) push the meeting line into a ridge, commonly called the Jet streams.
Knowing the driving forces of these separate, Lunar tidal, and Planetary ionic charge, patterns, it is a simple matter to figure the composite patterns generated, would have effects that could be seen in the historic data bases.
I have been searching for years to find the relationships between the cyclic patterns that could be used as a Natural Analog Forecast, that would take advantage of the patterns to form a forecast for the next cyclic repeat of the complex pattern if a good synchronization could be found to apply to the data base.
The Rossby waves take four cycles of 27.32 days to circle the Earth, and play out the same type pattern in the same area again~109 days. Seasonal shifts have taken place the frontal boundaries are displaced North or South by the seasonal solar tide in the atmosphere. So it was imperative that I find a time period that would synchronize as many of minor cycles as possible.
I looked at a period of 38 years ago the same date, as a starting point, two Metonic cycles of 19 years, and keeps the 18.6 Year MN cycle of lunar declination close to the current values, but the four fold pattern of the Rossby waves were out a phase by half a cycle.
This sorting method left the data seasonally centered, but I found by looking at the forecasts it generated that Nature does not really care what the date is, the warmth of Spring comes when the right pattern of lunar declination cycle occurs closest to the solar crossing of the Equator.
Scrapped that idea, and tried 13, 550 days (or 37 years and 36 days ago) as a center reference, and 6558 days either side of that date, to synchronize the past three cycles of raw data together. The average of the Temperatures, and the maximum 24 hour precipitation totals, is what I am currently posting on my web site.
This sets the four fold pattern of the Rossby waves in phase so the cycles with (zonal flow periods in from the west coast)[one of the four repeating patterns] all come in phase in the combined data, so that pattern is conserved. The included Lunar declinational angle, is with in a degree or so of the same for all three cycles and the present forecast one, so the extremes are in phase.
But the forecast daily High and Low temperatures, are time shifted off, and lag by a month, behind actuals, this could be fixed in the final product by adjusting the forecast by the amount the seasonal average temperatures are different from the month time laged date’s normal averages. In the middle of winter and summer they work fine but the seasonal shifts in spring and fall are still time lagged a month.
I considered this a fixable problem, and a good trade off to get the precipitation patterns as right as I could, at any cost. That at least seems to have worked well.
-
Aerology
- Posts: 18
- Joined: Mon Apr 28, 2008 3:29 am
Re: Electrical weather based analog forecast
I’ll just stand by my tornado forecast from the "this is simple thread"...
in response to "what makes people want to chase tornadoes?"
Posted: Mar 19, 2008 4:59 AM
If I told you the best dates for chasing were:
March 28-30th
April 4th
April 10-12th
April 25th-28th
May 22-24th
June 4th-6th
Would you schedule your vacation, or change your wedding plans,
on the chance I was going to be right??
As we are coming up on the June 4th - 6th dates, and the maps I used to generate these comments are still posted to my site unaltered....
-
Aerology
- Posts: 18
- Joined: Mon Apr 28, 2008 3:29 am
Re: Electrical weather based analog forecast
Copy of post over on the BAUT site:
Parting post in last thread.....
Quote:
03-June-2008, 04:52 AM
Default 30 days almost up
I wanted to at least post this info before I got locked out of posting anything else.
My 2008 tropical storm / hurricane forecast as of may 3rd...
http://www.aerology.com
If you would be interested in looking at the detailed maps it has generated for
the whole year of 2008, enter these.....
Kstate ........user name
Maps08 .......password
for your use looking at
the severe weather days as well as the three or four, tropical
disturbances that will probably have names as they come ashore.
Around July 6th- 12th,
August 18 thru 23rd,
September 14th thru 19th,
and another around October 5th thru October 18th.
If you have the time to look at this and send a reply I would greatly
appreciate it.
Richard Holle
The synodic conjunction of Earth with Jupiter was on the 9th of July 2008, centered in the July 6th thru 12th hurricane window in my forecast above.
Hurricane Bertha was rated above a simple tropical storm for these same days, and now that the concentrated Ion stream between the sun and Jupiter has been passed thru by the Earth, the effects are again minimized, I see this global weather intensification effect every year, as the synodic conjunctions with the outer gas planets occur.
It would be nice to compare the synodic dates in the past with the occurrence dates of past hurricanes to see the rate of correlation, in the recorded history, if links could be found where the dates could be exported into a spread sheet and plotted, it might be very illuminating.
I am working on getting a better handle on seasonally adjusting the temperatures in my forecast by using data from the 54.6 day later periods averaged into the original data to get a set of combined values, that better reflect the seasonal norms, as well as still conserving the patterns of modulation of the Lunar declinational atmospheric tides.
-
MattEU

- Posts: 367
- Joined: Sun Jun 29, 2008 8:00 am
- Contact:
Localised weather caused by the EU?
Hello Aerology and all,
A Butterfly flaps its wings on one side of the world....
The Med has a few other meteorological phenomenon (in both senses of the word), if anyone is interested I can post a few more details on them.
Can the EU Theory or Electric Weather provide a specifc model or explanation for the Alkyonides or Malta’s summer periods of weather?
I know that the Moon does affect the weather (depending on where the old hippy lives he will say that you get less/more rain as the full moon approaches) but could it be Electricity energy creating or helping to form the Alkyonides or Malta’s weather?
Shouldn't this discussion be in Planetary Science though to encourage more discussion of how the EU affects our lives, every moment of the day, through the weather? Then we can guarantee to have something new to talk about every day
I am interested to know if your models have taken into account localised weather phenomenon or which ones you have studied? Maybe micro areas through their own electrical energy potential between the salty sea and the land, or the local EU energy exchange, can temporarily effect its own micro climate?Electricity and weather are inextricable linked. But electricity does not necessarily cause local weather to behave in a certain way since there are many other stronger factors. But it does influence global weather, which in turn influences local weather
A Butterfly flaps its wings on one side of the world....
I live in the Mediterranean on the islands of Malta and have been observing its weather for the last year. Malta and Gozo are very windy and comparatively cloud active Islands. Especially in summer when it should be fairly stable. It is all relative. In summer if we should have hardly any weather disturbances and we constantly get periods of “weather” then it is relatively a lot of weather.http://en.wikipedia.org/wiki/Alkyonides
The term Alkyonides also refers to a meteorological phenomenon of the central Greek climate. Nearly every year in the period after Christmas until the middle of January there is a non-interrupted period of days with clear blue skies and warm temperatures, which at least in the Athens region can reach more than 20°C over the day.
A Butterfly flaps its wings on one side of the world.... and that’s the end of that story.http://en.wikipedia.org/wiki/Mediterranean_climate
Mediterranean climate zones are associated with the five large subtropical high pressure cells of the oceans, the Azores High, South Atlantic High, North Pacific High, South Pacific High, and Indian Ocean High. These high pressure cells shift polarward in the summer and equatorward in the winter, playing a major role in the formation of the world's tropical deserts and the zones of Mediterranean climate polarward of the deserts.
The Med has a few other meteorological phenomenon (in both senses of the word), if anyone is interested I can post a few more details on them.
Can the EU Theory or Electric Weather provide a specifc model or explanation for the Alkyonides or Malta’s summer periods of weather?
I know that the Moon does affect the weather (depending on where the old hippy lives he will say that you get less/more rain as the full moon approaches) but could it be Electricity energy creating or helping to form the Alkyonides or Malta’s weather?
Shouldn't this discussion be in Planetary Science though to encourage more discussion of how the EU affects our lives, every moment of the day, through the weather? Then we can guarantee to have something new to talk about every day
-
Aerology
- Posts: 18
- Joined: Mon Apr 28, 2008 3:29 am
Re: Electrical weather based analog forecast
The forecast I generate using the last three cycles of the repeating pattern, is a composite of the last three temperatures, from each reporting station averaged together and plotted as a composite contour map...At the time of the original posting on
http://www.bautforum.com/against-mainst ... ather.html
I had a seasonal adjustment problem of about 35 days delay in the forecast to the actuals, I have resolved that problem and the programmer is in the process of regenerating the temperature contour maps. He has already been paid for the work he was supposed to do, it just isn't done yet, but he is real busy at his day job....
More detail can be found in the original thread from BAUT,
the process uses local data points and a cyclic time period, when the global circulation conditions are almost the same, so local reoccurring patterns should stand out, above the noise. I have made forecasts for the Morning Glory Wave occurrence in Australia, in the past, and have been asked to do one for this upcoming season. I hope to be able to fire up my old Macintosh ( been off for four years now) and find all of my old data base intact....?
http://www.dropbears.com/brough/aerology.htm
So it seems that local phenomenon are easily predicted by this repeating pattern.....
All you need is a good set of data that goes back 60 years, the denser the concentration of reporting stations the better the forecast coverage results.
-
MattEU
- Posts: 367
- Joined: Sun Jun 29, 2008 8:00 am
- Contact:
Morning Glory Clouds
Any suggestions or advise on getting hold of old weather data? I have never even considered it and would not know where to start. Although I suppose it would be different in Europe than to America.
When you do your forecast for the Morning Glory Cloud would you post something on here? It is a great Electric Weather event that was discussed on the old forum thread and can be still be viewed at Planetary Science - Recovered: Earth (Telluric) Currents
You being able to predict these rare meteorological phenomenon should one day help to "kill" the idea that these clouds and our weather is caused by hot air (from the "scientists" ) meeting cold air etc...
For anyone who has not seen these amazing Roll Clouds there are good links from http://en.wikipedia.org/wiki/Morning_Glory_cloud to do with the Gulf Morning Glory Cloud in Australia and also Sable Island (off Nova Scotia)
Sable Island

Gulf Morning Glory Cloud - False Primary?

When you do your forecast for the Morning Glory Cloud would you post something on here? It is a great Electric Weather event that was discussed on the old forum thread and can be still be viewed at Planetary Science - Recovered: Earth (Telluric) Currents
You being able to predict these rare meteorological phenomenon should one day help to "kill" the idea that these clouds and our weather is caused by hot air (from the "scientists"
For anyone who has not seen these amazing Roll Clouds there are good links from http://en.wikipedia.org/wiki/Morning_Glory_cloud to do with the Gulf Morning Glory Cloud in Australia and also Sable Island (off Nova Scotia)
Sable Island
Gulf Morning Glory Cloud - False Primary?
-
dahlenaz

- Posts: 470
- Joined: Mon Mar 17, 2008 11:58 am
- Location: SD Arizona
- Contact:
Re: Electrical weather based analog forecast
I wonder if you could expand on this statement which is along the same lines as the subject of a page that i'm working on as an extension to the observation that were made which led to an ICOPS 2006 poster presentation about our Hypersensitve Solar System.Aerology wrote in paragraph 12 of his initial post;
Adds positive ion energy to hurricanes that are moving to the mid latitudes, (that just happen to be) in sync with the lunar equatorial crossings (North or South).
Here is a link to the original material. http://www.para-az.com/poster06.html
There is a link, at the bottom of the page, to a pdf version which was converted by Dave Smith in 2007, but the link i'd like to draw your attention to is just before the first chart.
Here is what the link will look like when the page is ready; //www.para-az.com/lunar-pattern.html . UNTIL IT IS READY you'll need to add a capital L ahead of lunar, if you want to read the thoughts that are being assembled from my observations and inexperienced imagination.
Lunar equatorial crossings are one aspect that i'm attempting to highlight, but i'm sure it is not clearly understood in my mind. It is, however, one of several unique aspect of the timing of hurricanes, that i think should be taken into consideration from the electric universe perspective.
Some of the statements at the Llunar page are not necessarily accurate at this point since they are just thoughts that were rolling off my noggen while trying to consider any possibilities that i should look into further. Your input is quite welcome on any aspect of the Hypersensitive Solar System material. d....z
http://www.dahlendesigns.com ---=----=--- http://www.electric-spark-scars.com
-
Aerology
- Posts: 18
- Joined: Mon Apr 28, 2008 3:29 am
Re: Electrical weather based analog forecast
As we pass the galactic center (GC) midsummer, and the Earth moves out of the increased magnetic coupling between the sun and the GC and a global discharge pattern sets up, for the production of tropical storms as the heat and electrical energy is released wringing out the moisture, built up over the summer, as a long charge cycle, shifts to a long term discharge cycle.
The combination of the phase of the 18.6 year Mn cycle (now just past peak (2006) North / South declinational angles) and the resultant global rebalancing of the volume originally displaced from the equator, determines the volumes of cold dry, arctic air, that out washes, in discharge cycles, short term, and seasonal (cold a** winters, for the next two years) and increased dry summers.
The peak production of Hurricanes in 2005, literally came with the peak of the Lunar atmospheric declinational tides, and as you have seen when a water wave comes ashore there is a calm sliding out of the resultant calm water after the turbulence of the collapse and on shore rush is over. Which is why 2006 and 2007 were slower hurricane years, in the same type of retreat from turbulent flow, breakup and the ebb back out, of the Lunar declinational tides in the atmosphere.
The outer planets as they have a synodic conjunction with the Earth induct additional ionic charge into the global circuit,
which induces positive ions to move from the sea surface into the air along, and either side of the ITCZ.
During the up slope phase (beginning of the charge part of the cycle) the increase in potential charge is felt as an electro magnetic effect that causes ions to move in response. Because of the lagging of the movement, behind the drive the rate of precipitation (normally a function of local discharge conditions) becomes inhibited, until the charge phase is complete and the precipitation rate, is greatly assisted by the discharge cycle dynamics.
The North /South declinational movement of the moon, and the atmospheric tides driven by it, are the prime movers of the Maridel flows, in the global circulation. Tropical air masses, storms intermeshed in them, and especially hurricanes move with these tides, so that their tracks are determined by the Tidal movements, but at the same time the charge and discharge effects of the outer planets, set the stage on their own agenda for the strengthening and weakening of the total storm force.
With Katrina and Rita the synodic conjunctions with Neptune and Uranus were in phase with the time of approaching land fall, so they under went a period of increased precipitation rates, and as a result were stronger storms.
With the recent landfall of Gustav, this was not the case, the midpoint between the synodic conjunctions this years was on the 31st of August, so there was a shift to charge phase just before Gustav came ashore, resulting in the weakening of his intensity.
Hanna may benefit from lolling around in the charge phase, gaining size and extra moisture to rain out later, and gain strength from, as Uranus shifts past synodic conjunction and on to a discharge phase, (September 13th) which will drive energy into storms that are around then.
-
dahlenaz
- Posts: 470
- Joined: Mon Mar 17, 2008 11:58 am
- Location: SD Arizona
- Contact:
Re: Electrical weather based analog forecast
In your reference to the outer planets I get the impression that you are not referring to Jupiter and Saturn. If so, How can those, so distant planets be of any affect to the earth? Can this be answered from an electric perspective or do your ideas come from another direction in the sciences?
Your reference to the sun - GC relationship in reference to the earths proximity is one detail that really catches my attention and to me it seems a significant factor in so much of what differentiates winter from summer in that our distance to the sun is closer in winter, if i recall correctly. Summer in the southern hemisphere must be a real scorcher, if the logic of solar distance = radiant heat has any merit. I havn't come across these notions in what little i've read so far or i missed them in what i have read. d....z
http://www.dahlendesigns.com
Who is online
Users browsing this forum: No registered users and 19 guests